Most power system models for industrial systems (e.g. ETAP, PTW, PowerFactory, etc) are put in the filing cabinet as soon as the design phase is over and the plant is operational. Occasionally, they are dusted off when a major expansion is planned, and although the models may be as-built, they are often not tuned with actual operating data.
The feedback loop between design and operations is therefore never closed, and design engineers are left none the wiser as to how accurate their load projections and design operating conditions are compared with real life conditions.
On the rare occasions that a model is tuned with real data, we’ve found that the original design models are usually far too conservative. This has tangible consequences. For example, design loads with the normally thick layers of allowances and contingencies can lead to specifying generators that operate at sub-optimally low loads, which can ultimately result in increased maintenance cost.
We recommend tuning power system models with actual operational data, e.g. Energy Management System (EMS), DCS or manual measurements from meters, preferably over a typical 24 hour period. As a minimum, the following data should be collected:
- Generator operating data (MW, MVAr, terminal voltage)
- Main busbar voltages
- Feeder operating data (MW, MVAr)
- Loads in service
- Reactive power compensation in service (including harmonic filter banks)
If the plant has distinct seasonal changes in operation, then separate scenarios should be generated for each of the seasonal load profiles.
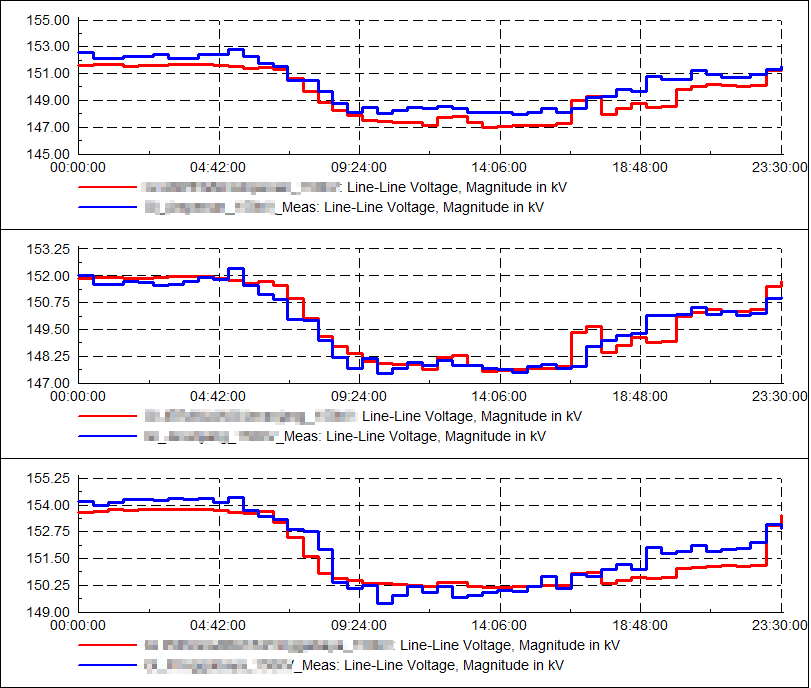
The results of the tuning exercise can be presented graphically by overlaying measured over simulated quantities (for example, voltages as in the figure above). The degree of overlap need not be perfect, but there should be good alignment between measured and simulated values with less than 2% error (there is <0.7% error in the figure above).